Inflation Is The Best Stock Market Forecaster
The best stock market forecaster for the next twelve months…
The best indicator of inflation is commodity prices.
One reason we highlight commodity prices is that they’re never revised once they’ve been made public. So they’re a reliable measure. However, commodity prices are relevant for another vital reason. Compared to all other indicators, commodities are highly correlated to fluctuations in inflation.
Bull markets hinge on the economy’s ability to grow without igniting inflation. Once inflation is a threat, you can kiss growth and stocks goodbye.
Commodity prices are the most straightforward, rawest expression of inflation. That’s because they are the basic building blocks of everything produced- the fuels, metals, paper, grains, and other foodstuffs refined, grounded, pounded, and packaged into life’s luxuries and necessities.
When commodity prices rise, so does the cost of many other products and services in ricochet fashion. Inflation then flares up and burns out economic growth; the bull market in stocks will surely end.
For example, a rise in oil prices eventually makes gasoline more expensive, increasing transportation costs. It boosts the prices of everything shipped, from food to computers to cars.
Likewise, higher grain prices raise the cost of cereal and bread. Because livestock depends on grains, meat becomes more expensive, too.
You don’t have to go back any further than the 1970s to see the incredible power of commodity prices over stocks. During that decade, commodities prices, from oil to grains, soared. The stock market scored a terrible performance that decade, only reaping an average of 1.3% annually if returns were inflation-adjusted.
Let’s stop for a moment and think about that!
If you bought a basket of stocks (the S&P 500) at the end of 1969 and held them through the end of 1979, you would have lost 14% of your investment in real terms, adjusted for inflation.
In contrast, let’s look at what happened in the 1980s when commodity prices generally trended down. Stocks gained an average of 11% per year, adjusted for inflation.
Which Commodities Are The Best Investments?
As you can see, commodity prices dramatically influence the stock market. The degree to which they do depends on how much they rise or fall collectively.
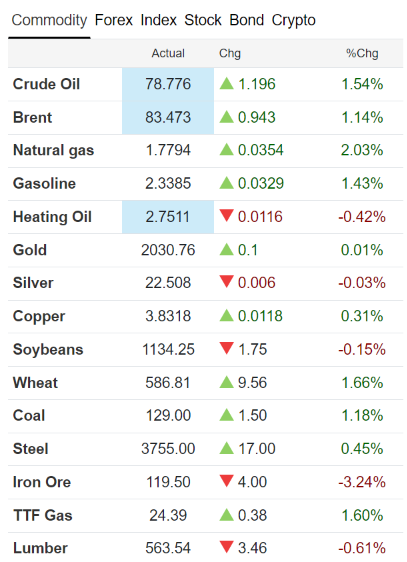
The Bureau of Labor Statistics (BLS) spot industrial price index is a lesser-known index that is one of the best stock market forecaster tools. The BLS index reflects daily fluctuating “spot” prices of global commodities. In other words, it shows what commodities currently cost today and indicates whether they have increased or decreased in price from the previous day.
Additionally, the BLS index weeds out commodities with only a marginal economic effect, resulting in an index of critical commodities, each with a strong and proven economic impact.

The graph above depicts BLS commodities at their current spot prices as of today’s publication date.
With the historical exception of oil, price spikes in a single commodity usually have little effect on the performance of stocks. For example, copper prices doubled from April 1988 to April 1989, partly due to rumors about a supply interruption from Chilean mines. However, inflation remained at bay, and stocks rose 14% during that time period (more than 17% if you factor dividends).
On Wall Street, the most popular index for measuring commodity prices is the Commodity Research Bureau’s (CRB) futures index, a composite of the prices of futures contracts for a myriad of commodities, from potatoes to orange juice. However, this composite has a few drawbacks because the CRB includes many commodities that don’t significantly impact the global economy. As a result, a move in this index may not have any impact unless the most essential commodities are at the root of it.
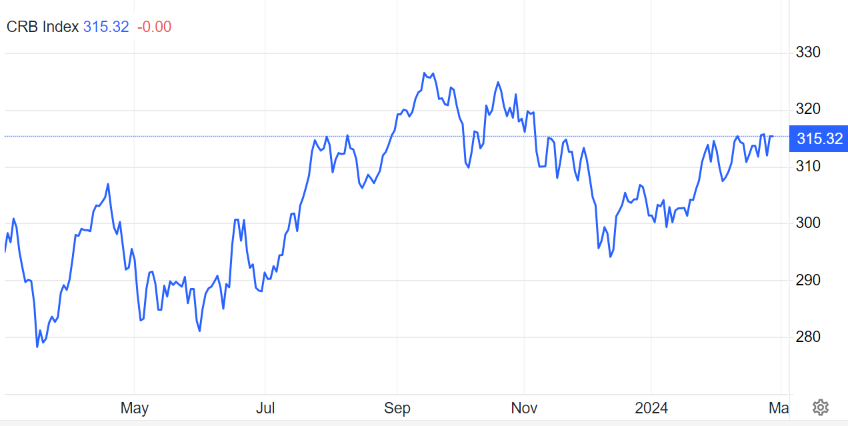
However, the chart below shows a glaringly obvious uptrend in inflation and commodity prices over the past year. The chart depicts the CRB Commodity Index, reflecting May 2023 and projected futures commodity prices into May 2024. Commodity prices hit a year high in Q4 of 2023 and, aside from a brief decline, have rebounded strongly.

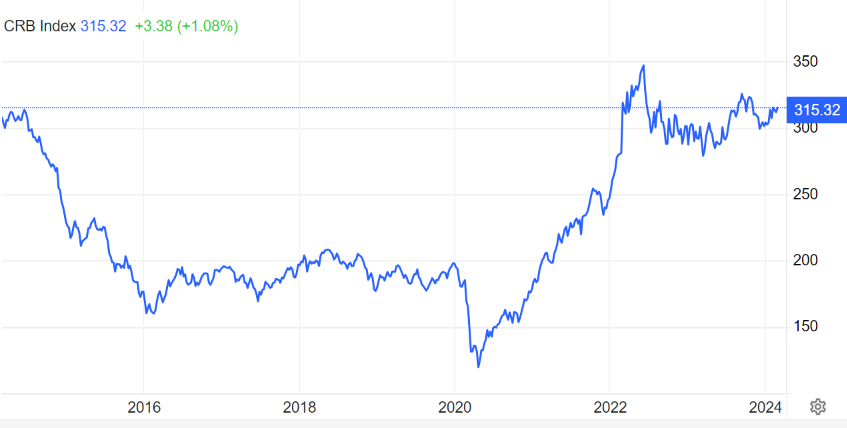
The graph below brings things full circle, depicting a ten-year trend in the CRB Commodity Index. A sharp decline in the commodity index started in late 2015 and continued into early 2020. Then, during mid-2020, a massive spike in commodity prices occurred. Today, the index has leveled off at a pre-2015 support level.

For commodity prices to boost inflation and negatively affect stocks, they must rise across the board. In other words, the prices of most commodities must be up-trending.
The best way to gauge the trend in commodity prices is to look at an index of various commodity prices. That way, spectacular increases in the price of one commodity will be put into context by how others fared.
What does this mean for investors?
It means investors should take heed to historical data and what it has to teach us in regard to high inflation and long-running spikes in commodity prices. As one of the best stock market forecaster tools, this data shows that once inflation becomes an economic threat, a slowdown in the returns of stocks and financial assets has resulted.
Here’s the bottom line: When commodity prices are stable or trending downward, you need not worry about the fiscal welfare your stocks. Conversely, when commodity prices are spiking and inflation is soaring, you might think twice about make some adjustments to your investment portfolio.
Disclaimer: Investors should make investment decisions based on personal financial goals and objectives. We aim to educate investors to make informed decisions by featuring historical financial and economic data publicly available on the CRB Commodity Index and Producer Price Index websites.
Get In Touch
Our investment professionals understand that building a wealth management strategy can be overwhelming. Start by scheduling a no-obligation investment consultation with a registered investment adviser representative.


